Scaling a brand from absolute zero to multiple six figures in revenue requires a precise, data-driven approach that leverages organic momentum alongside aggressive paid acquisition. For this client, the goal was clear: penetrate a competitive e-commerce landscape and establish immediate market share.
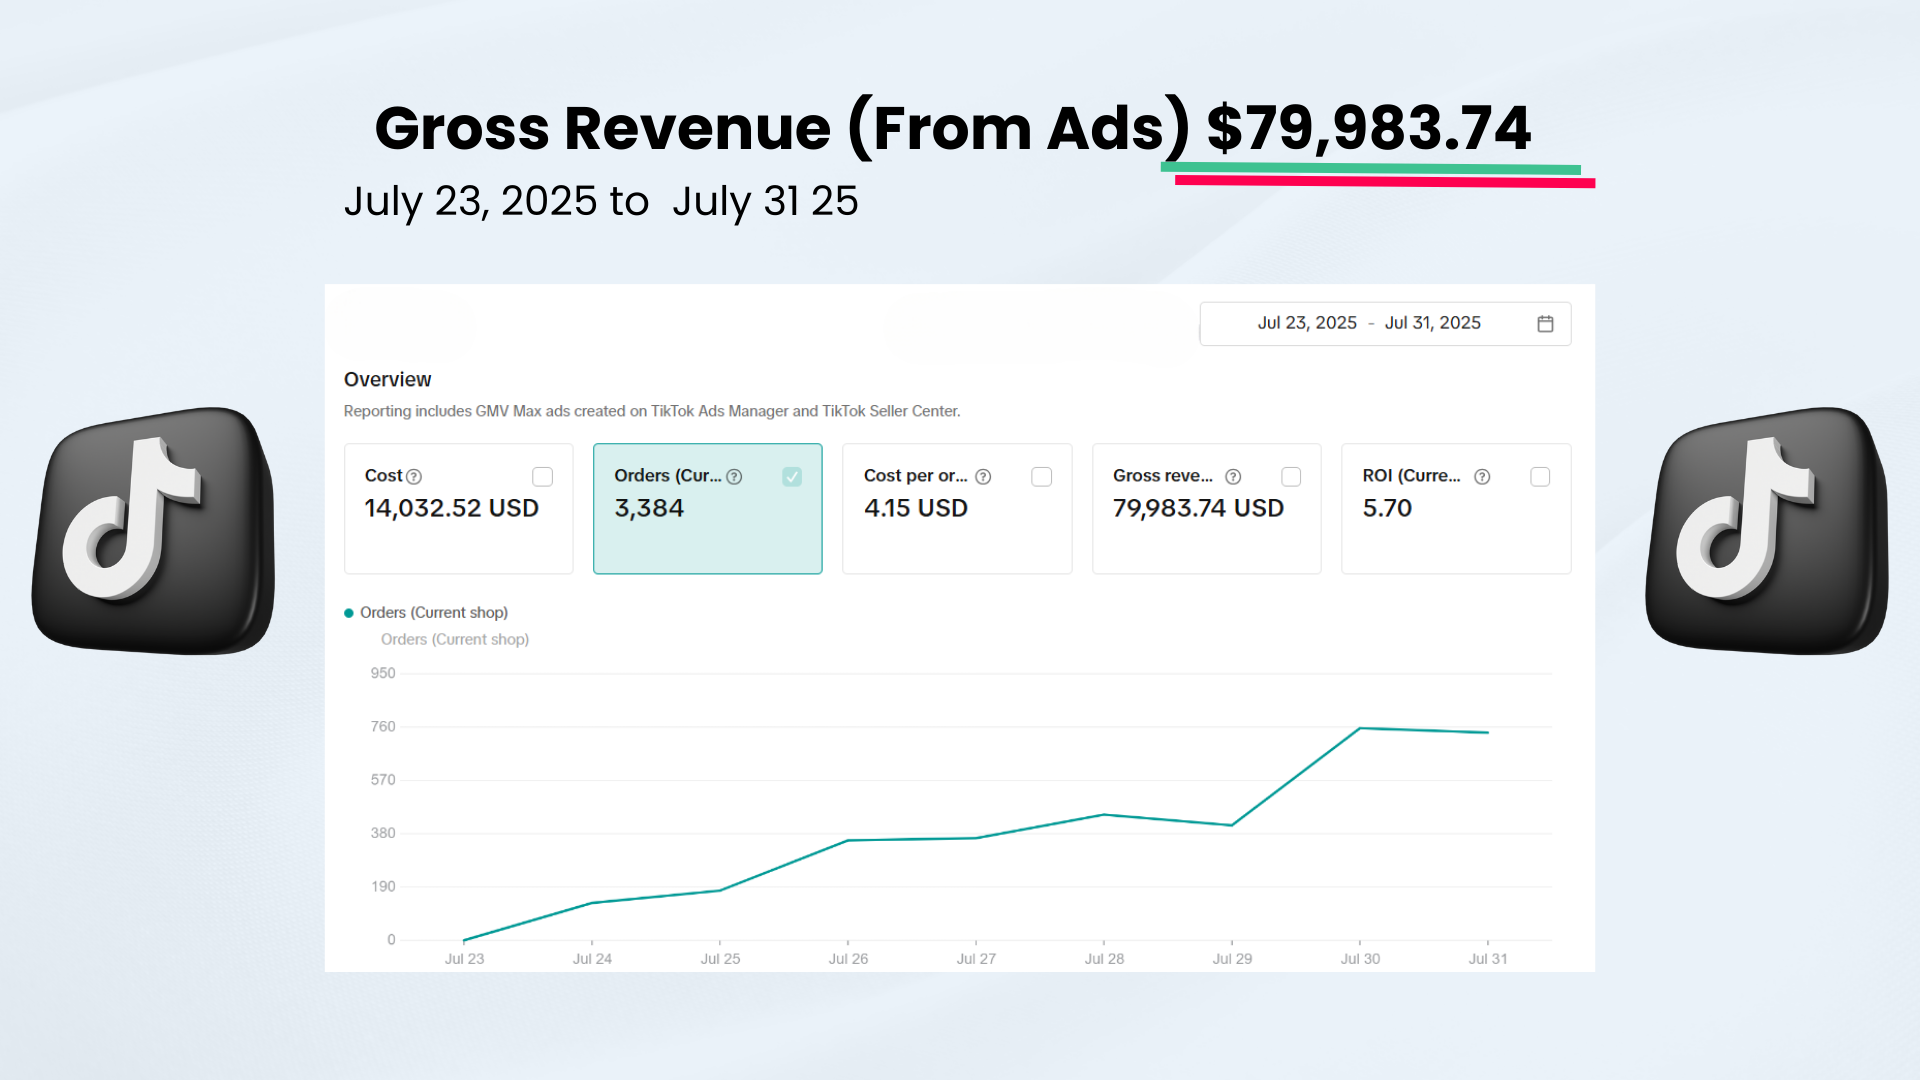
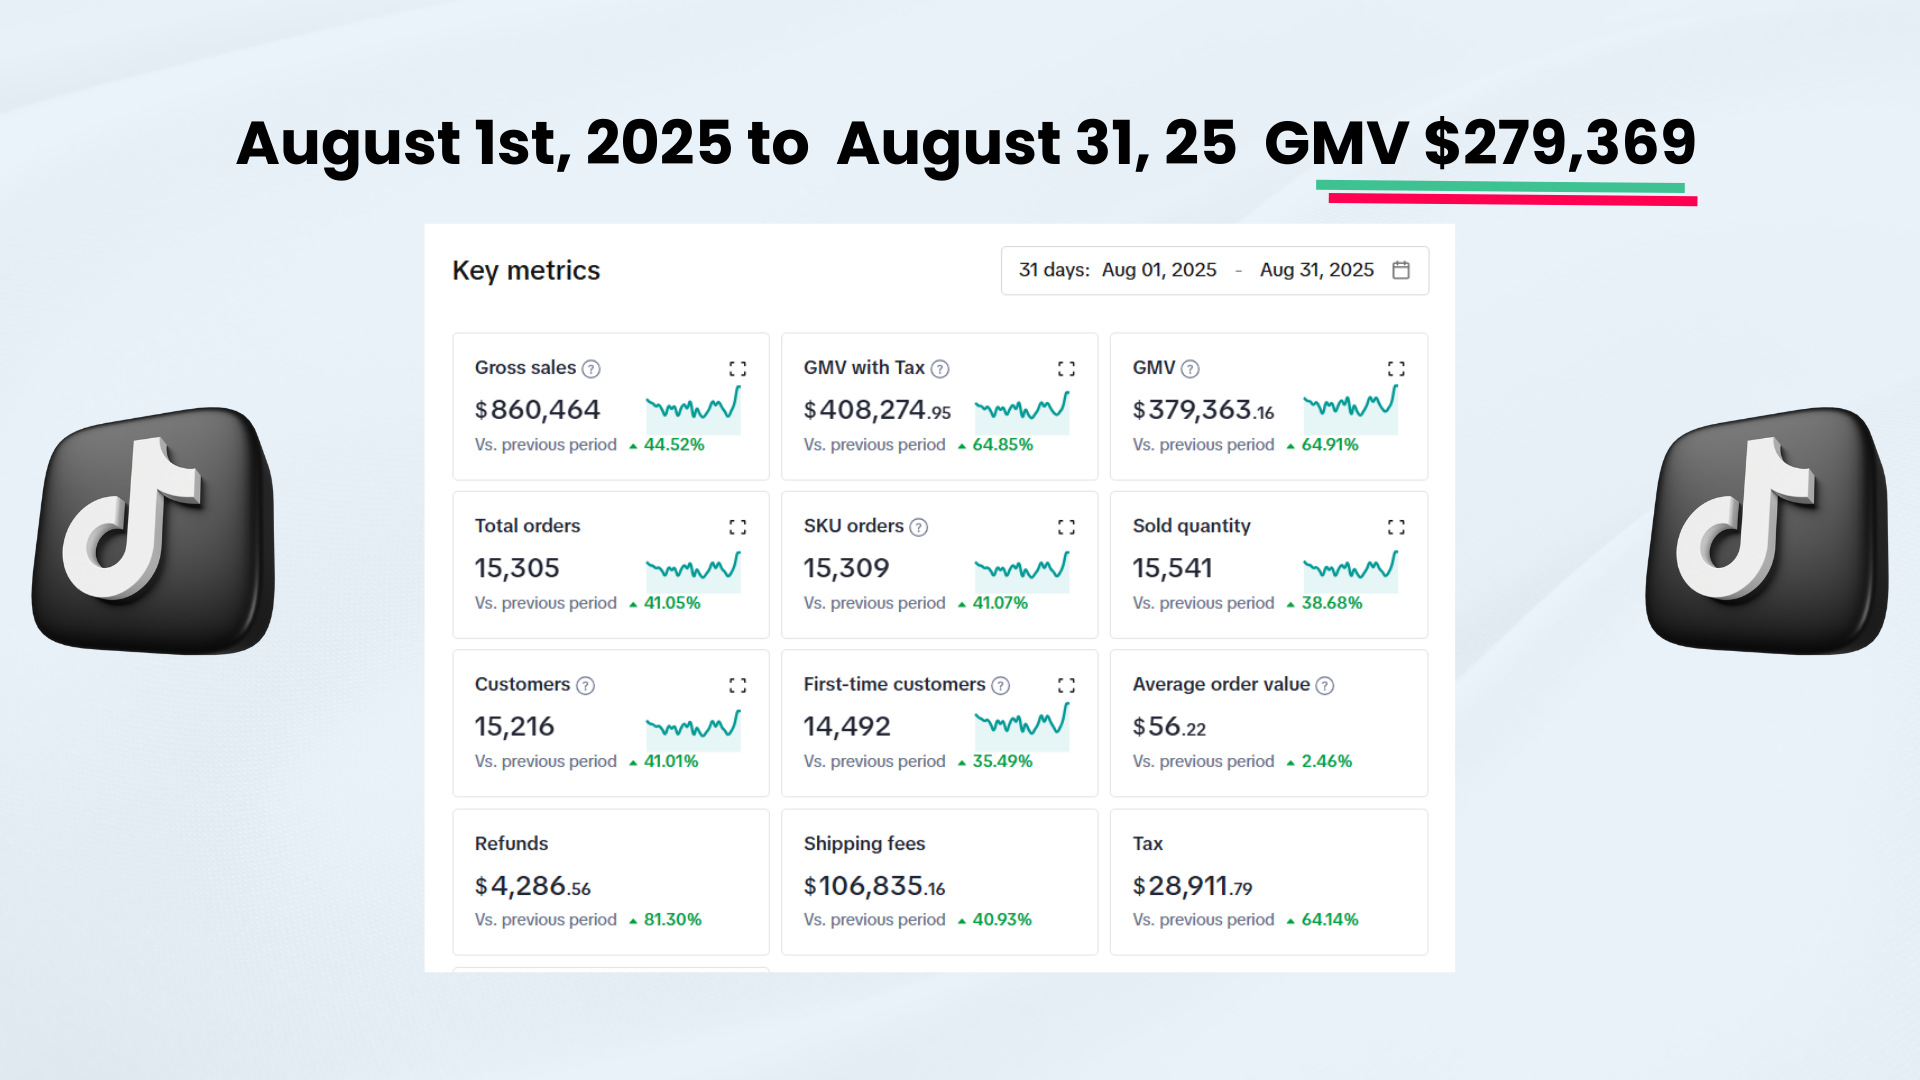
This case study details the comprehensive roadmap we utilized to generate over $700,000 in gross revenue in just 6 months, building a sustainable brand engine from the ground up.
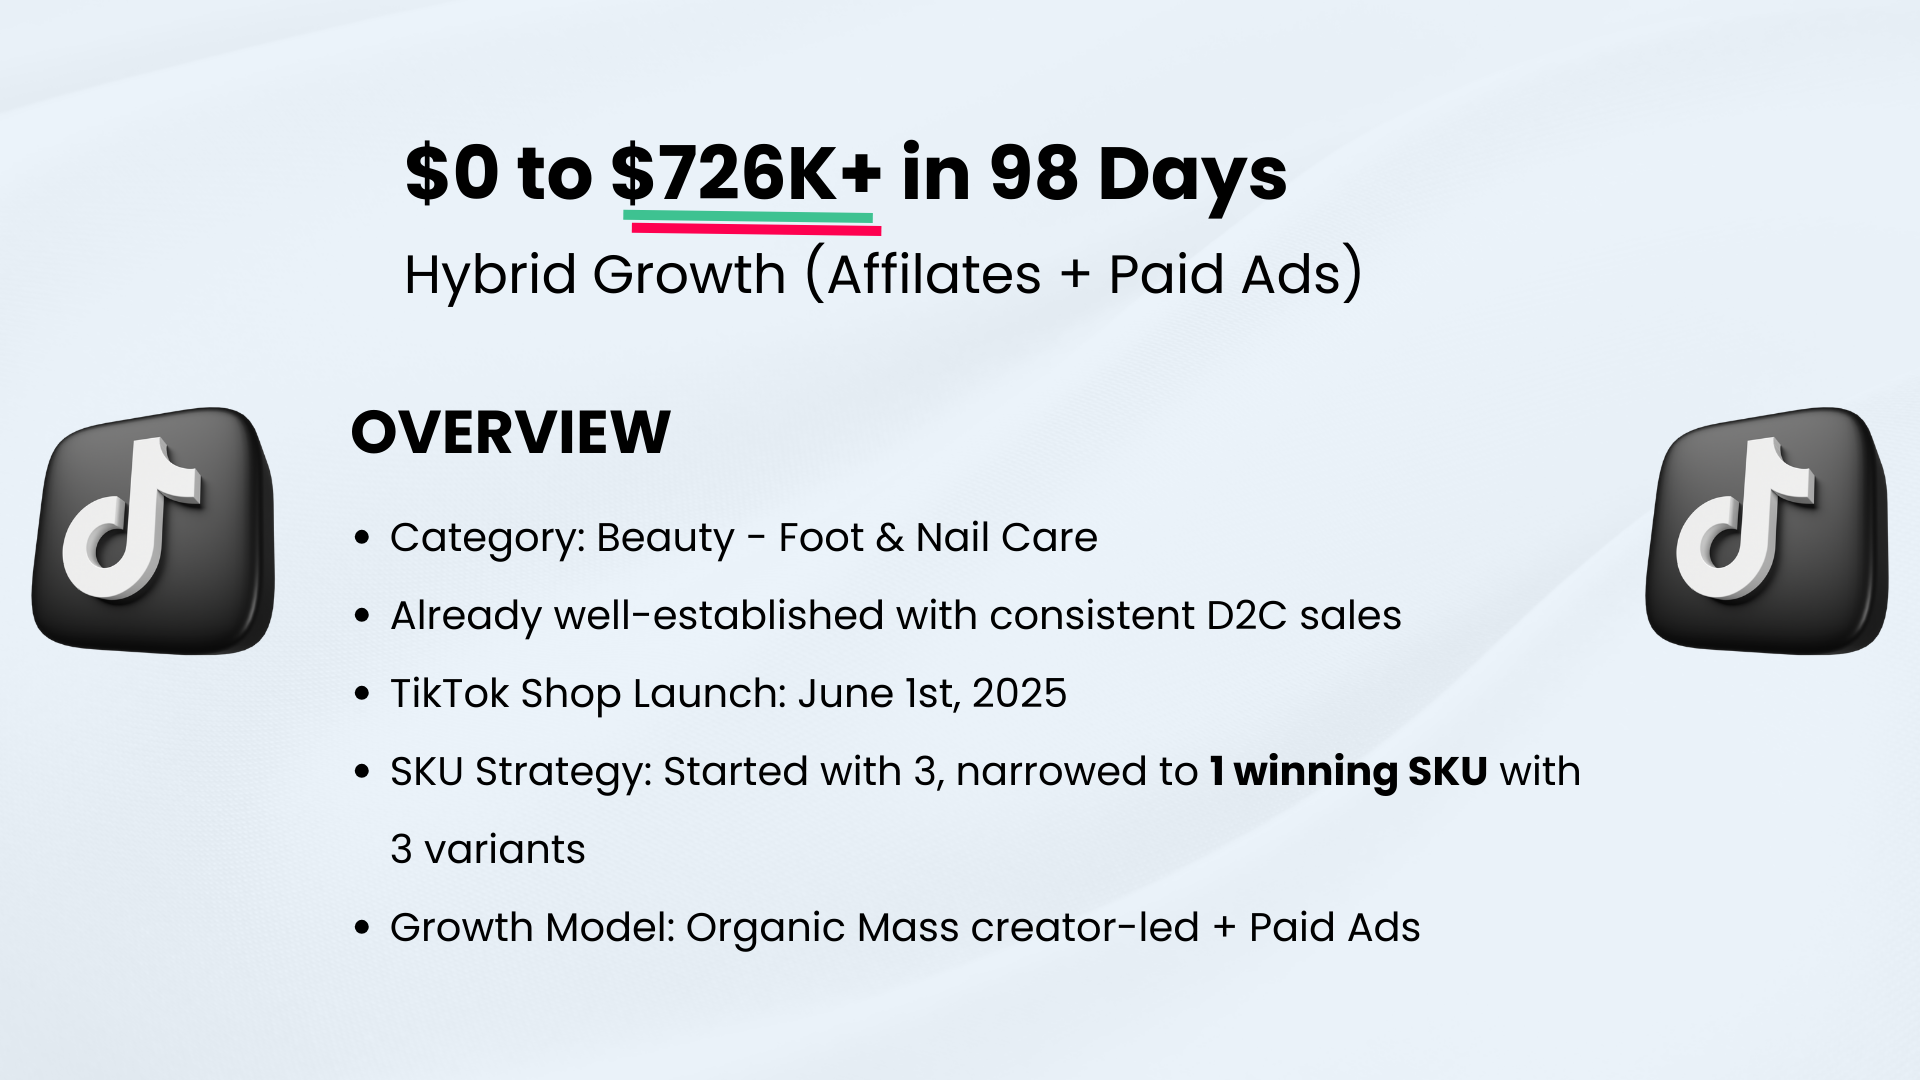
The Starting Line: Identifying the Gap
When the client launched, they had a solid product but zero brand recognition, no existing customer list, and no organic traffic. Attempting to immediately run direct-response conversion ads would have been burning money. We needed to build the foundation first.
Our initial audit revealed:
- Zero Pixel Data: We had no historical purchase data to train ad platforms on.
- Unoptimized Funnel: The initial landing pages were not built for conversion, lacking crucial trust elements.
- No Social Proof: The brand had no reviews, UGC, or established trust signals.
Phase 1: Infrastructure & The Offer
Before spending a single dollar on ads, we overhauled the conversion infrastructure. The best marketing in the world cannot save a poorly designed landing page.
Foundation Steps:
- Irresistible Offer Creation: We bundled their core products into a high-perceived-value offer that made the decision a no-brainer for first-time buyers.
- Landing Page Optimization: Rebuilt the product pages utilizing direct-response copywriting principles, highlighting benefits over features, and integrating "frictionless" checkout flows.
- Review Seeding: Implemented a targeted early-adopter program to generate initial high-quality reviews and text-based testimonials to establish baseline trust.
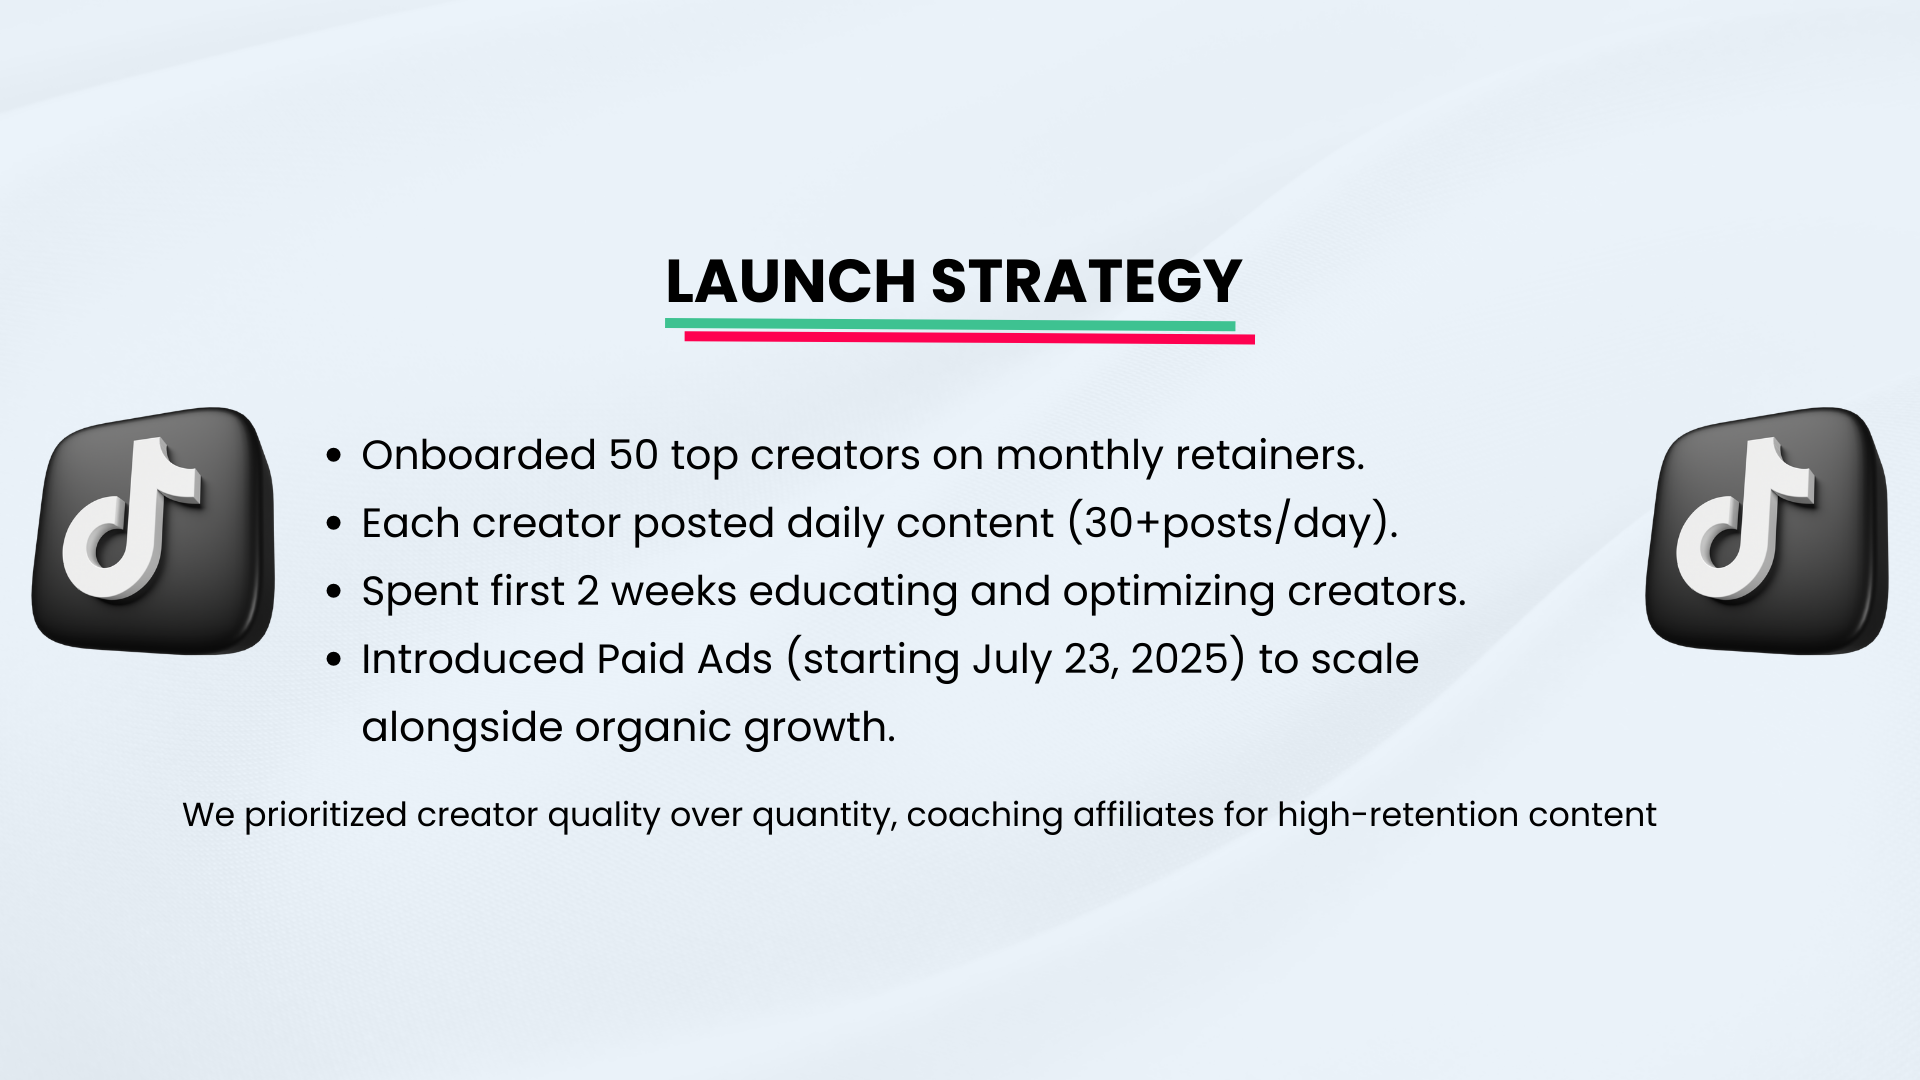
Phase 2: Testing & Top of Funnel (TOF) Acquisition
With the funnel optimized, we needed traffic. We adopted a broad-testing methodology to rapidly identify winning creative angles and target demographics without exhausting the initial budget.
The Acquisition Strategy:
- Dynamic Creative Testing: We launched dozens of ad variations—mixing different hooks, body text, and visual formats (UGC vs. high-production)—to find what resonated over the first 30 days.
- Educational Hooks: Instead of hard-selling, the initial ads focused on the "problem/solution" dynamic, educating the consumer on why they needed the product.
- Lookalike Audience Seeding: As the first early buyers came through, we immediately fed that data back into the algorithm to construct robust 1% and 3% Lookalike audiences.
Phase 3: The Omnichannel Scaling Engine
Once we identified our winning creatives and established a baseline CPA (Cost Per Acquisition), it was time to scale aggressively and horizontally across multiple platforms.
Scaling Mechanics:
- Retargeting Architecture: Implemented a complex middle-of-funnel (MOF) and bottom-of-funnel (BOF) retargeting strategy. Users who engaged but didn't buy were shown social proof ads; users who abandoned carts were shown urgency/discount ads.
- Platform Expansion: After dominating initial social channels, we expanded into search intent (Google Ads) to capture high-intent buyers actively looking for solutions in this niche.
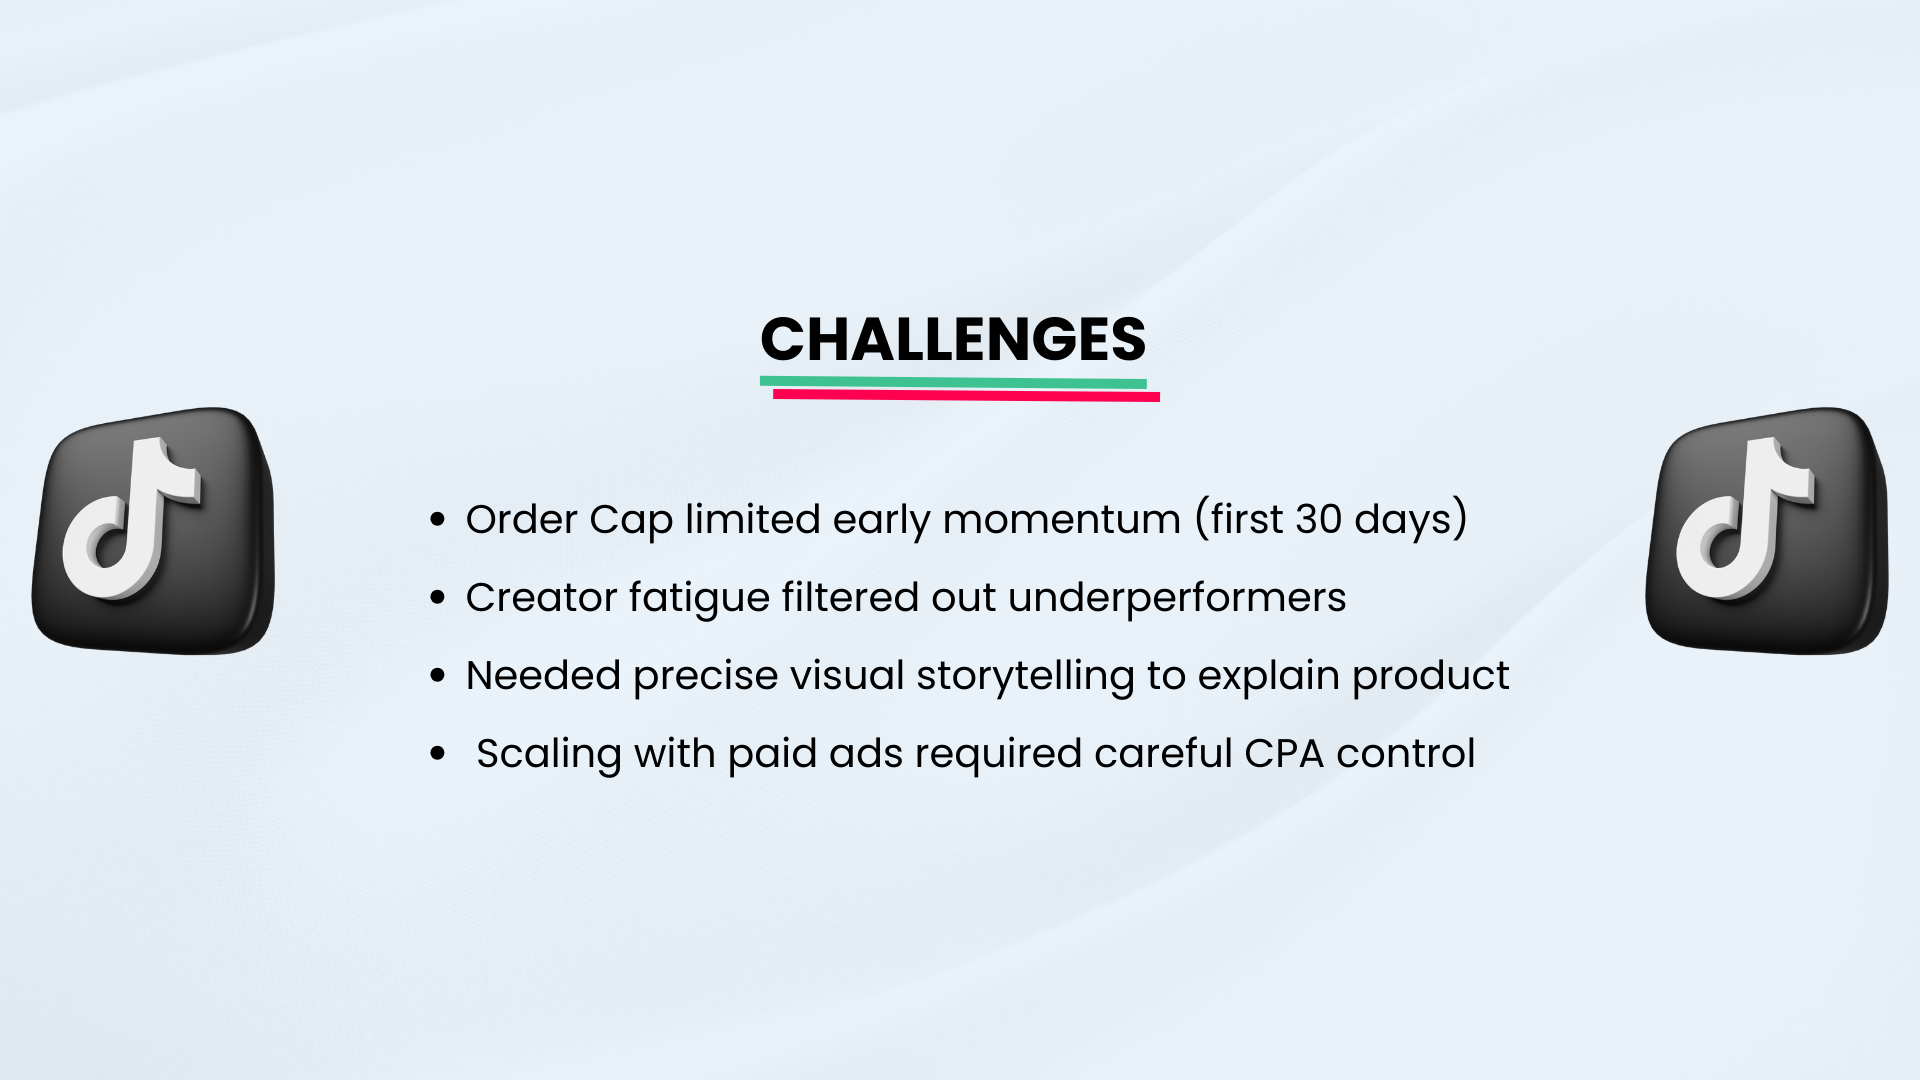
Strategic Refinements & Revenue Maximization
Bringing in new customers is only half the battle. To hit the $700k mark efficiently, we had to maximize the Lifetime Value (LTV) of every acquired user.
- Post-Purchase Upsells: Integrated seamless 1-click upsell offers immediately after the initial checkout, drastically increasing the Average Order Value (AOV).
- Email & SMS Flows: Deployed comprehensive automated flows (Welcome Series, Abandoned Cart, Win-back) which eventually accounted for roughly 25% of total revenue.
The Final Blueprint
The trajectory from $0 to $700k was not luck; it was the execution of a disciplined, phase-based growth framework.
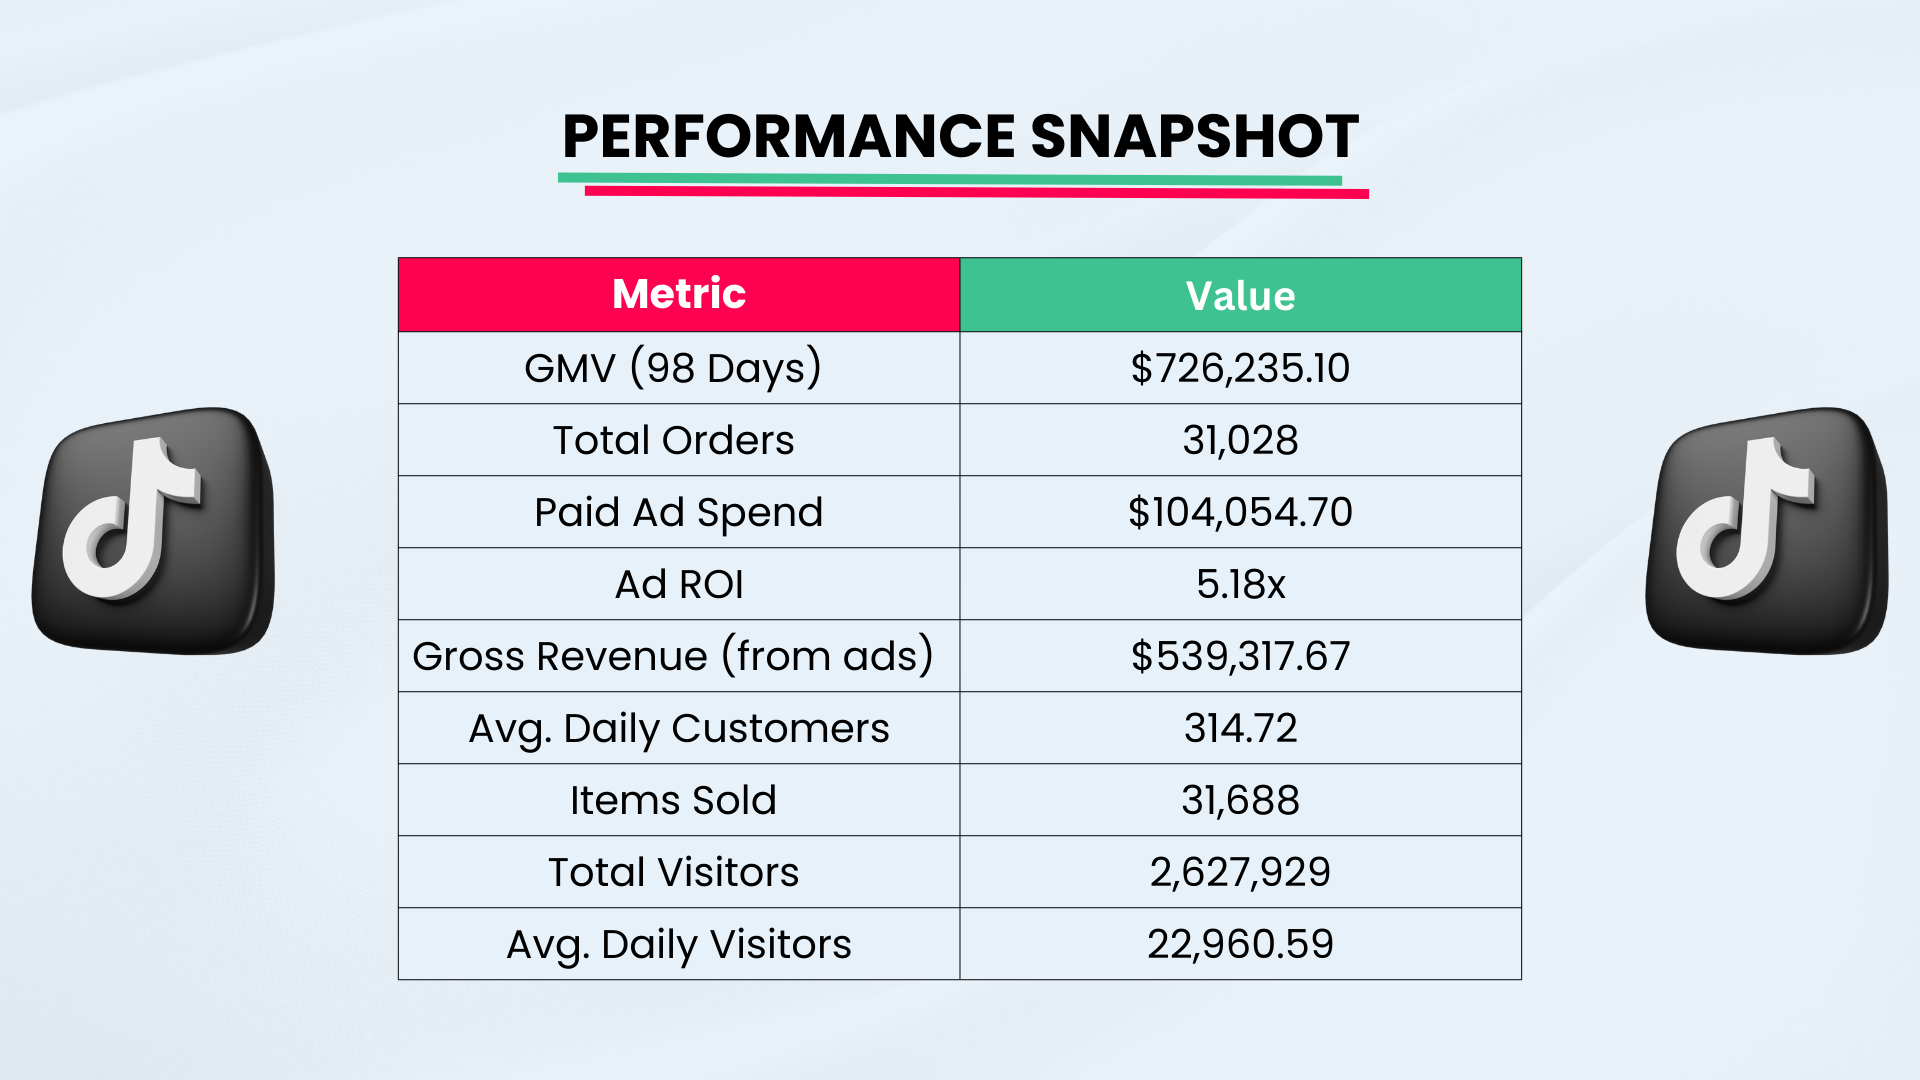
Project Outcomes:
- Total Revenue: Surpassed the $700,000 threshold strictly within the 6-month timeframe.
- Healthy Margins: Maintained a blended ROAS of 3.2x throughout the heaviest scaling periods.
- Evergreen Asset: Left the client with a massive, validated customer list, a highly trained ad account pixel, and a predictable engine for future growth.